Michelle L. Santee

and 9 more

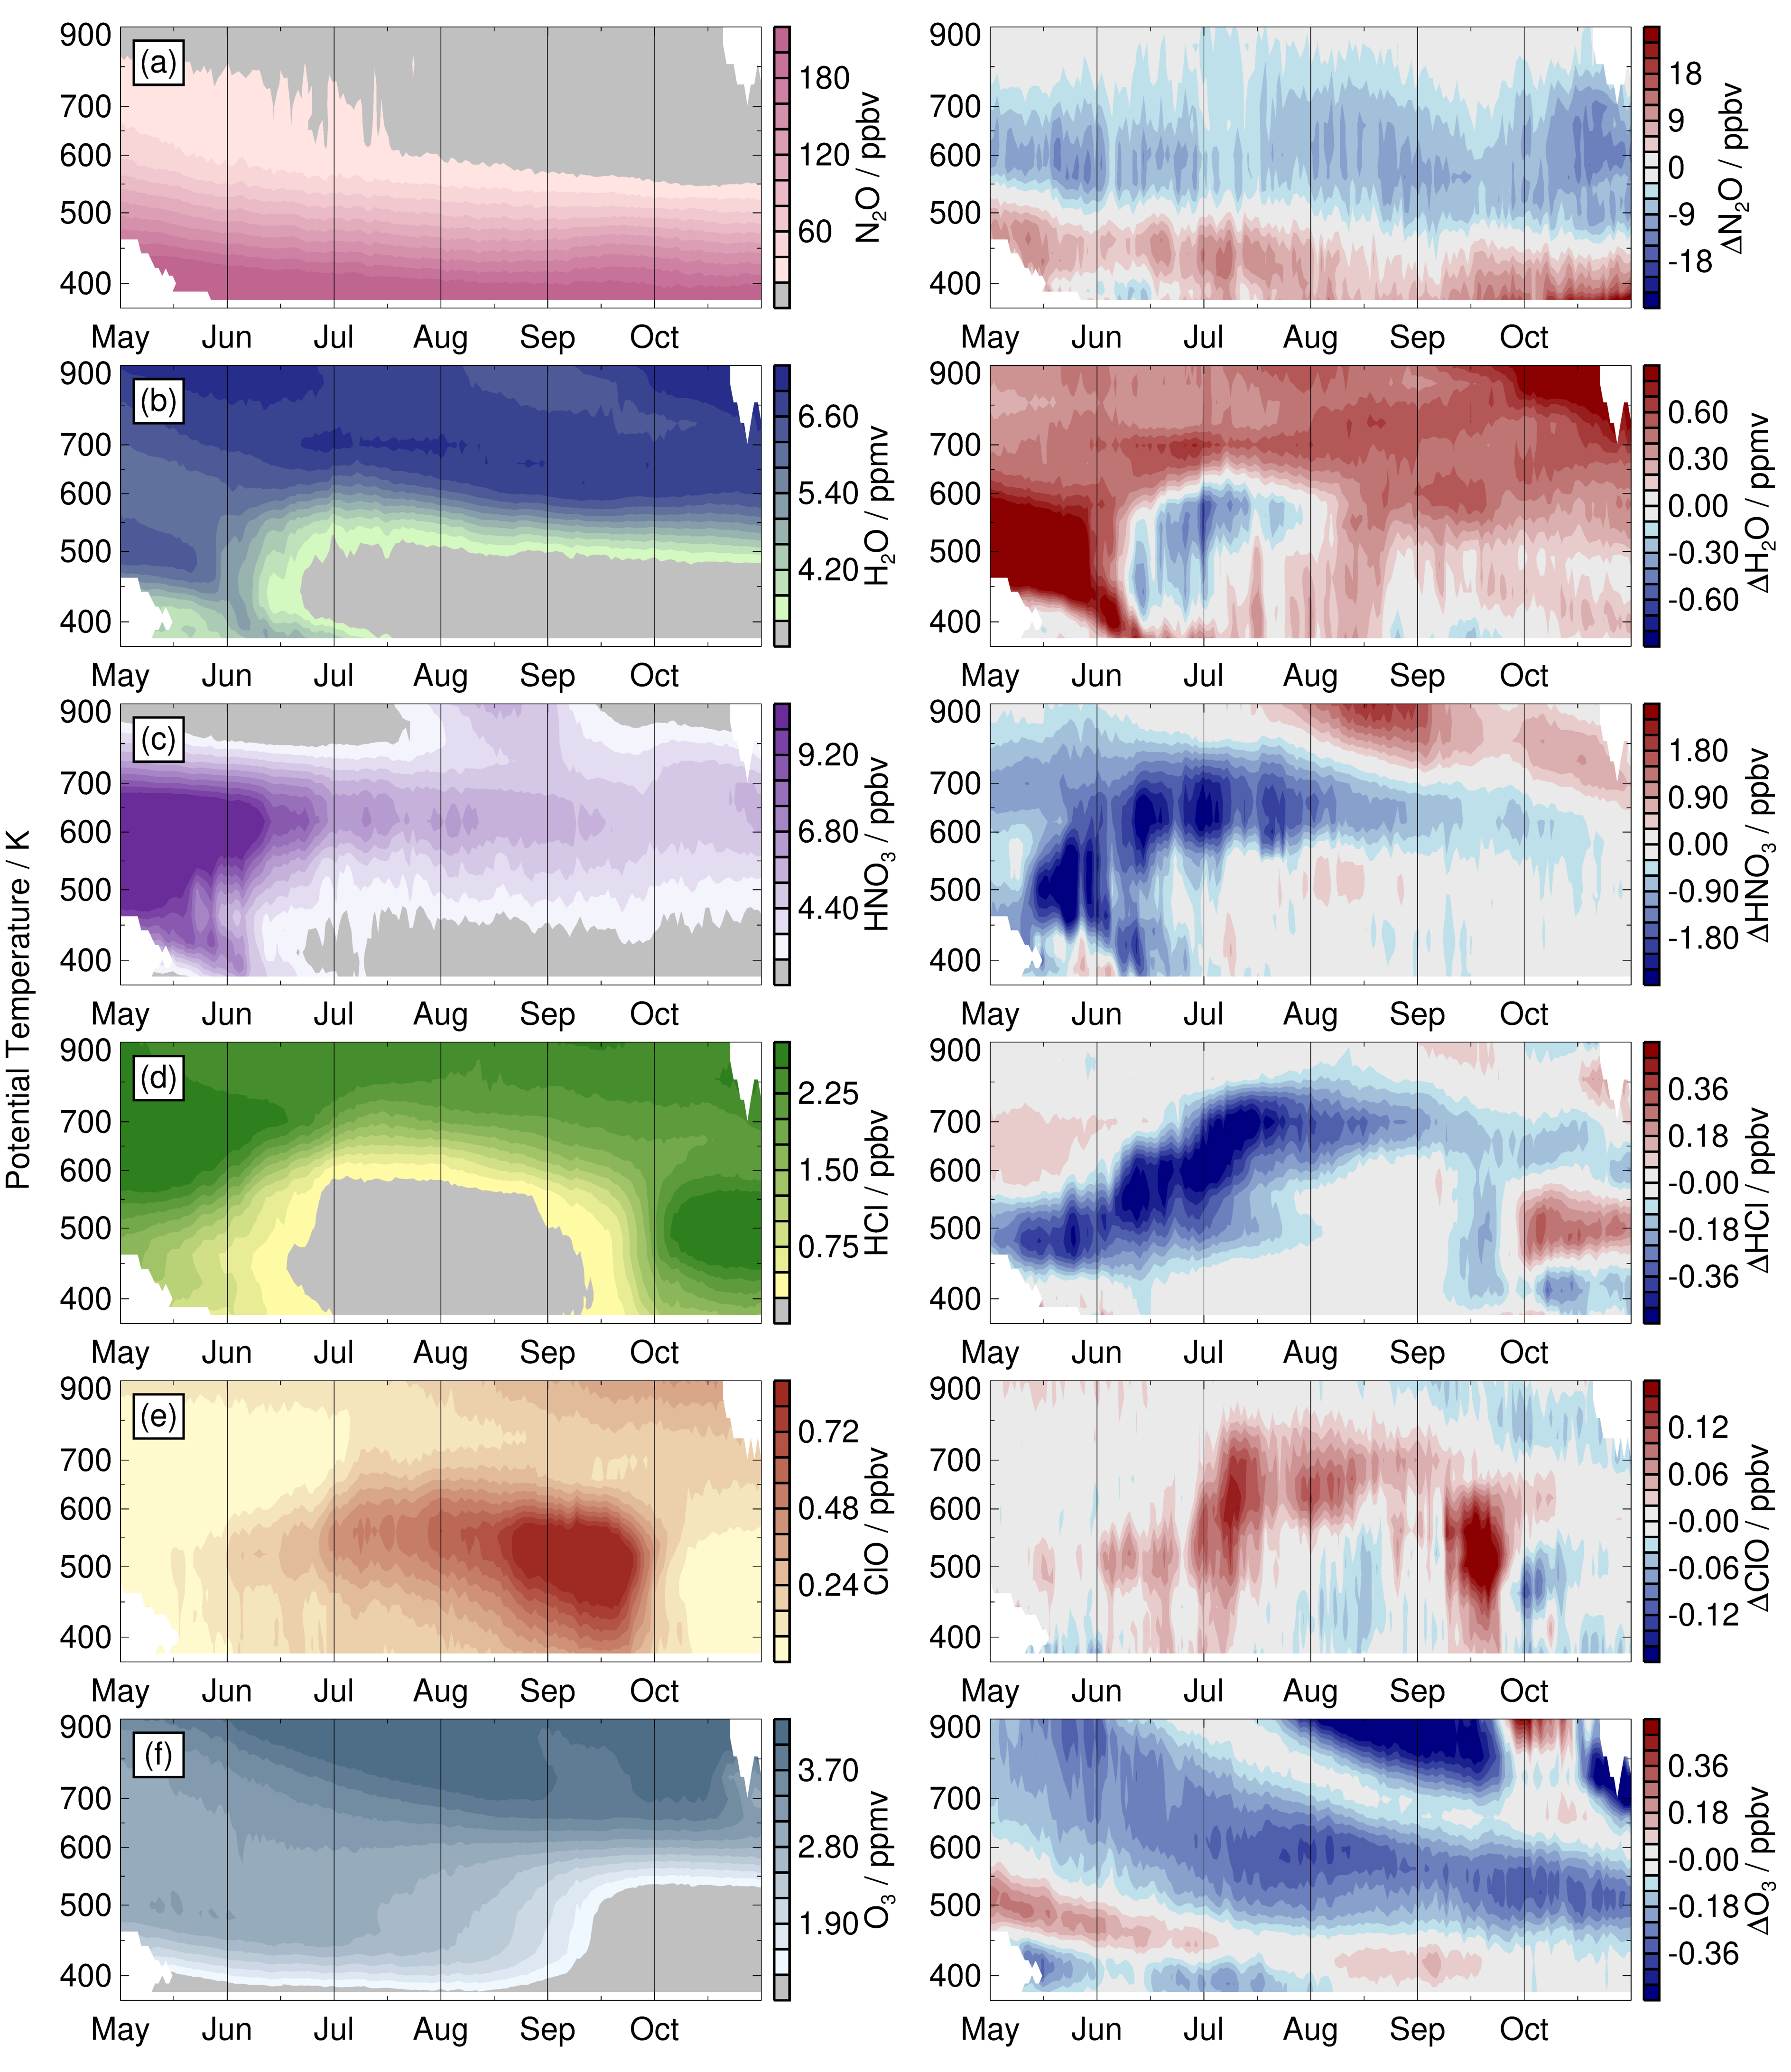
The January 2022 eruption of Hunga Tonga-Hunga Ha’apai (HT-HH) caused the largest enhancement in stratospheric aerosol loading in decades and produced an unprecedented enhancement in stratospheric water vapor, which led to strong stratospheric cooling that in turn induced changes in the large-scale circulation. Here we use satellite measurements of gas-phase constituents together with aerosol extinction to investigate the extent to which the thick aerosol, excess moisture, and strong cooling enabled heterogeneous chemical processing. In the southern tropics, unambiguous signatures of substantial chlorine and nitrogen repartitioning appear over a broad vertical domain almost immediately after the eruption, with depletion of N2O5, NOx, and HCl accompanied by enhancement of HNO3, ClO, and ClONO2. After initially rising steeply, HNO3 and ClO plateau, maintaining fairly constant abundances for several months. These patterns are consistent with the saturation of N2O5 hydrolysis, suggesting that this reaction is the primary mechanism for the observed composition changes. The southern midlatitudes and subtropics show similar but weaker enhancements in ClO and ClONO2. In those regions, however, effects of anomalous transport dominate the evolution of HNO3 and HCl, obscuring the signs of heterogeneous processing. Perturbations in chlorine species are considerably weaker than those measured in the southern midlatitude stratosphere following the Australian New Year’s fires in 2020. The moderate HT-HH-induced enhancements in reactive chlorine seen throughout the southern middle and low-latitude stratosphere, far smaller than those in typical winter polar vortices, do not lead to appreciable chemical ozone loss; rather, extrapolar lower-stratospheric ozone remains primarily controlled by dynamical processes.

Michelle L. Santee

and 8 more

The 2022 Hunga eruption led to extraordinary water vapor enhancement throughout the stratospheric vortex at the beginning of the 2023 Antarctic winter. Although the dynamical characteristics of the vortex itself were generally unexceptional, the excess moisture initially raised the threshold temperatures for the formation of polar stratospheric clouds (PSCs) above typical values over a broad vertical domain. Low temperatures, especially during an early-July cold spell, prompted ice PSC formation and unusually severe irreversible dehydration at higher levels (500–700 K), while atypical rehydration occurred at lower levels (380–460 K). Heterogeneous chemical processing was more extensive, both vertically (up to 750–800 K) and temporally (earlier in the season), than in prior Antarctic winters. The resultant HCl depletion and ClO enhancement both redefined their previously observed ranges at and above 600 K. Albeit unmatched in the satellite record, the early-winter upper-level chlorine activation was insufficient to induce substantial ozone loss. Chlorine activation, denitrification, and dehydration processes saturated in midwinter, with trace gas evolution essentially following the climatological mean thereafter. Chlorine deactivation started slightly later than in most years. While cumulative ozone losses at 410–550 K were relatively large, probably because of the delayed chlorine deactivation, they were not unprecedented. Thus, ozone depletion was unremarkable throughout the lower stratosphere. Although Hunga hastened the onset of and increased the vertical extent of PSC formation and chlorine activation in early winter, saturation of lower stratospheric chemical processing (as is typical in the Antarctic) prevented an exceptionally severe ozone hole in 2023.

Kristof Bognar

and 17 more

In the winter and spring of 2019/2020, the unusually cold, strong, and stable polar vortex created favorable conditions for ozone depletion in the Arctic. Chemical ozone loss started earlier than in any previous year in the satellite era, and continued until the end of March, resulting in the unprecedented reduction of the ozone column. The vortex was located above the Polar Environment Atmospheric Research Laboratory in Eureka, Canada (80 °N, 86 °W) from late February to the end of April, presenting an excellent opportunity to examine ozone loss from a single ground station. Measurements from a suite of instruments show that total column ozone in 2020 was at an all-time low in the 20-year dataset, 22 to 102 DU below previous records set in 2011. Ozone minima (<200 DU), enhanced OClO and BrO slant columns, and unusually low HCl, ClONO2 , and HNO3 columns were observed in March. Polar stratospheric clouds were present as late as 20 March, and ozonesondes show unprecedented depletion in the March and April ozone profiles (to <0.2 ppmv). While both chemical and dynamical factors lead to reduced ozone when the vortex is cold, the contribution of chemical depletion was exceptional in spring 2020 when compared to typical Arctic winters. The mean chemical ozone loss over Eureka was estimated to be 111-127 DU (27-31%) using April measurements and passive ozone from the SLIMCAT chemical transport model. While absolute ozone loss was generally smaller in 2020 than in 2011, percentage ozone loss was greater in 2020.

Gloria L Manney

and 10 more

The exceptionally strong and long-lived Arctic stratospheric polar vortex in 2019/2020 resulted in large transport anomalies throughout the fall-winter-spring period from vortex development to breakup. These anomalies are studied using Aura MLS long-lived trace gas data for N2O, H2O,and CO, ACE-FTS CH4 , and meteorological and trace gas fields from reanalyses. Strongest anomalies are seen throughout the winter in the lower through middle stratosphere (from about 500K through 700K), with record low (high) departures from climatology in N2O and CH4 (H2O). CO also shows extreme high anomalies in midwinter through spring down to about 550K. Examination of descent rates, vortex confinement, and trace gas distributions in the preceding months indicates that the early-winter anomalies in N2O and H2O arose primarily from entrainment of air with already-anomalous values (which likely resulted from transport linked to an early January sudden stratospheric warming the previous winter during a favorable quasi-biennial oscillation phase) into the vortex as it developed in fall 2019 followed by descent of those anomalies to lower levels within the vortex. Trace gas anomalies in midwinter through the late vortex breakup in spring 2020 arose primarily from inhibition of mixing between vortex and extravortex air because of the exceptionally strong and persistent vortex. Persistent strong N2O and H2O gradients across the vortex edge demonstrate that air within the vortex and its remnants remained very strongly confined through late April (mid-May) in the middle (lower) stratosphere.

Sean M. Davis

and 15 more

Since June 2017, the Stratospheric Aerosol and Gas Experiment III instrument on the International Space Station (SAGE III/ISS) has been providing vertical profiles of upper tropospheric to stratospheric water vapor (WV) retrieved from solar occultation transmission measurements. The goal of this paper is to evaluate the publicly released SAGE III/ISS beta version 5.1 WV retrieval through intercomparison with independent satellite- and balloon-based measurements, and to present recommendations for SAGE III/ISS data quality screening criteria. Overall, we find that SAGE III/ISS provides high quality water vapor measurements. Low quality profiles are predominately due to retrieval instabilities in the upper stratosphere that cause step-like changes in the profile, and aerosol/cloud-related interferences (below ~20 km). Above 35 km, the retrieved uncertainty and noise in the data rapidly grow with increasing altitude due to relatively low extinction signal from water vapor. Below the tropopause, retrieved uncertainty increases with decreasing altitude due to enhanced molecular scattering and aerosol extinction. After screening low-quality data using the procedures described herein, SAGE III/ISS WV is shown to be in good agreement with independent satellite and balloon-based measurements. From 20 – 40 km, SAGE III/ISS WV v5.1 data exhibit a bias of 0.0 to -0.5 ppmv (~10 %) relative to the independent data, depending on the instrument and altitude. Despite its status as a beta version, the level of SAGE III/ISS WV agreement with independent data is similar to previous SAGE instruments, and therefore the data are suitable for scientific studies of stratospheric water vapor.