Tiffany Goh

and 3 more

The importance of scale when investigating ecological patterns and processes is recognised across many species. In marine ecosystems, the processes that drive species distribution have a hierarchical structure over multiple nested spatial and temporal scales. Hence, multi-scale approaches should be considered when developing accurate distribution models to identify key habitats, particularly for populations of conservation concern. Here, we propose a modelling procedure to identify the best spatial and temporal scale for each modelled and remotely sensed oceanographic variable to model harbour porpoise (Phocoena phocoena) distribution. Harbour porpoise sightings were recorded during dedicated line-transect aerial surveys conducted in the summer of 2016, 2021 and 2022 in the northeast Atlantic. Binary generalised additive models were used to assess the relationships between porpoise presence and oceanographic variables at different spatial (5, 20 and 40 km) and temporal (daily, monthly and across survey period) scales. Selected variables included sea surface temperature, thermal fronts, chlorophyll-a, sea surface height, mixed layer depth and salinity. A total of 30,514 km was covered on-effort with 216 harbour porpoise sightings recorded. Overall, the best spatial scale corresponded to the coarsest resolution considered in this study (40 km), while porpoise presence showed stronger association with oceanographic variables summarised at a longer temporal scale (monthly and averaged over survey period). Habitat models including covariates at coarse spatial and temporal scales may better reflect the processes driving availability and abundance of prey resources at the large scales covered during the surveys. These findings support the hypothesis that a multi-scale approach should be applied when investigating species distribution. Identifying suitable spatial and temporal scale would improve the functional interpretation of the underlying relationships, particularly when studying how a small marine predator interacts with its environment and responds to climate and ecosystem changes.

Nicole Todd

and 3 more

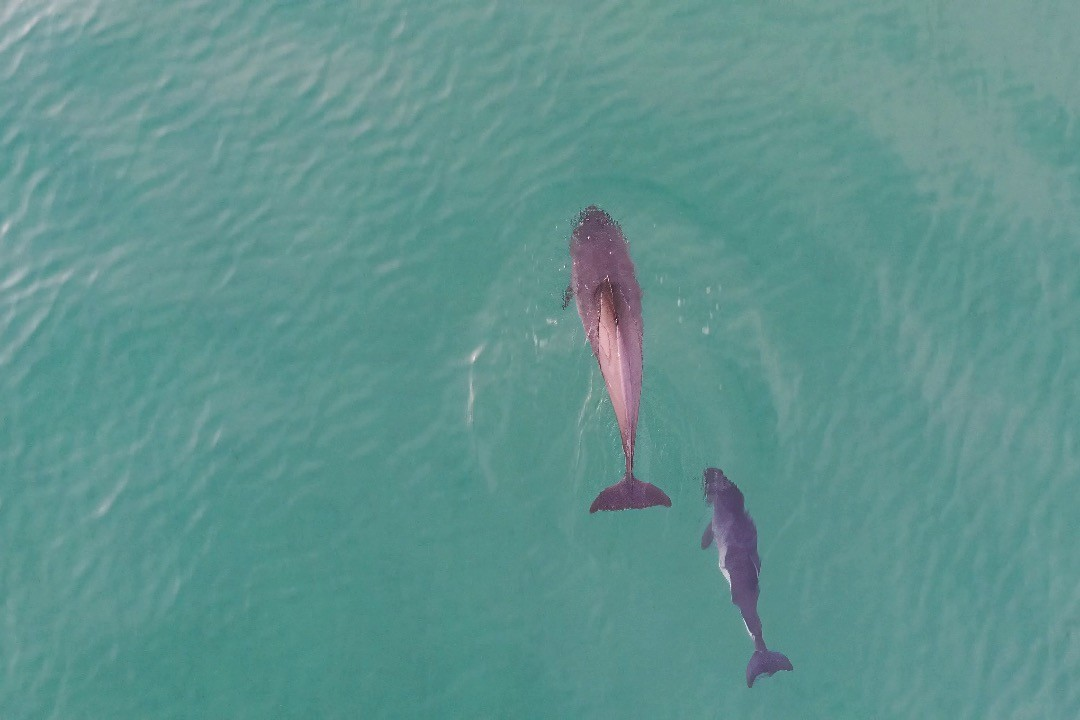
Passive acoustic monitoring (PAM) is a cost-effective method for monitoring cetacean populations compared to techniques such as aerial and ship-based surveys. The C-POD (Cetacean POrpoise Detector) has become an integral tool in monitoring programmes globally for over a decade, providing standardised metrics of occurrence that can be compared across time and space. However, the phasing out of C-PODs following development of the new F-POD (Full waveform capture Pod) with increased sensitivity, improved train detection, and reduced false positive rates, represents an important methodological change in data collection, particularly when being introduced into existing monitoring programmes. Here, we compare the performance of the C-POD with that of its successor, the F-POD, co-deployed in a field setting for 15 months, to monitor harbour porpoise (Phocoena phocoena). While similar temporal trends in detections were found for both devices, the C-POD detected only 58% of the detection positive minutes (DPM), recorded by the F-POD. Differences in detection rates were not consistent through time making it difficult to apply a correction factor or directly compare results obtained from the two PODs. To test whether these differences in detection rates would have an effect on analyses of temporal patterns and environmental drivers of occurrence, generalised additive models (GAMs) were applied. No differences were found in seasonal patterns or the environmental correlates of porpoise occurrence (month, diel period, temperature, environmental noise, and tide). However, the C-POD failed to detect sufficient foraging buzzes to identify temporal patterns in foraging behaviour that were clearly shown by the F-POD. Our results suggest that the switch to F-PODs will have little effect on determining broad-scale seasonal patterns of occurrence, but may improve our understanding of fine-scale behaviours such as foraging. We highlight how care must be taken interpreting F-POD results as indicative of increased occurrence when used in time-series analysis.