Joaquin Diaz Pena

and 5 more

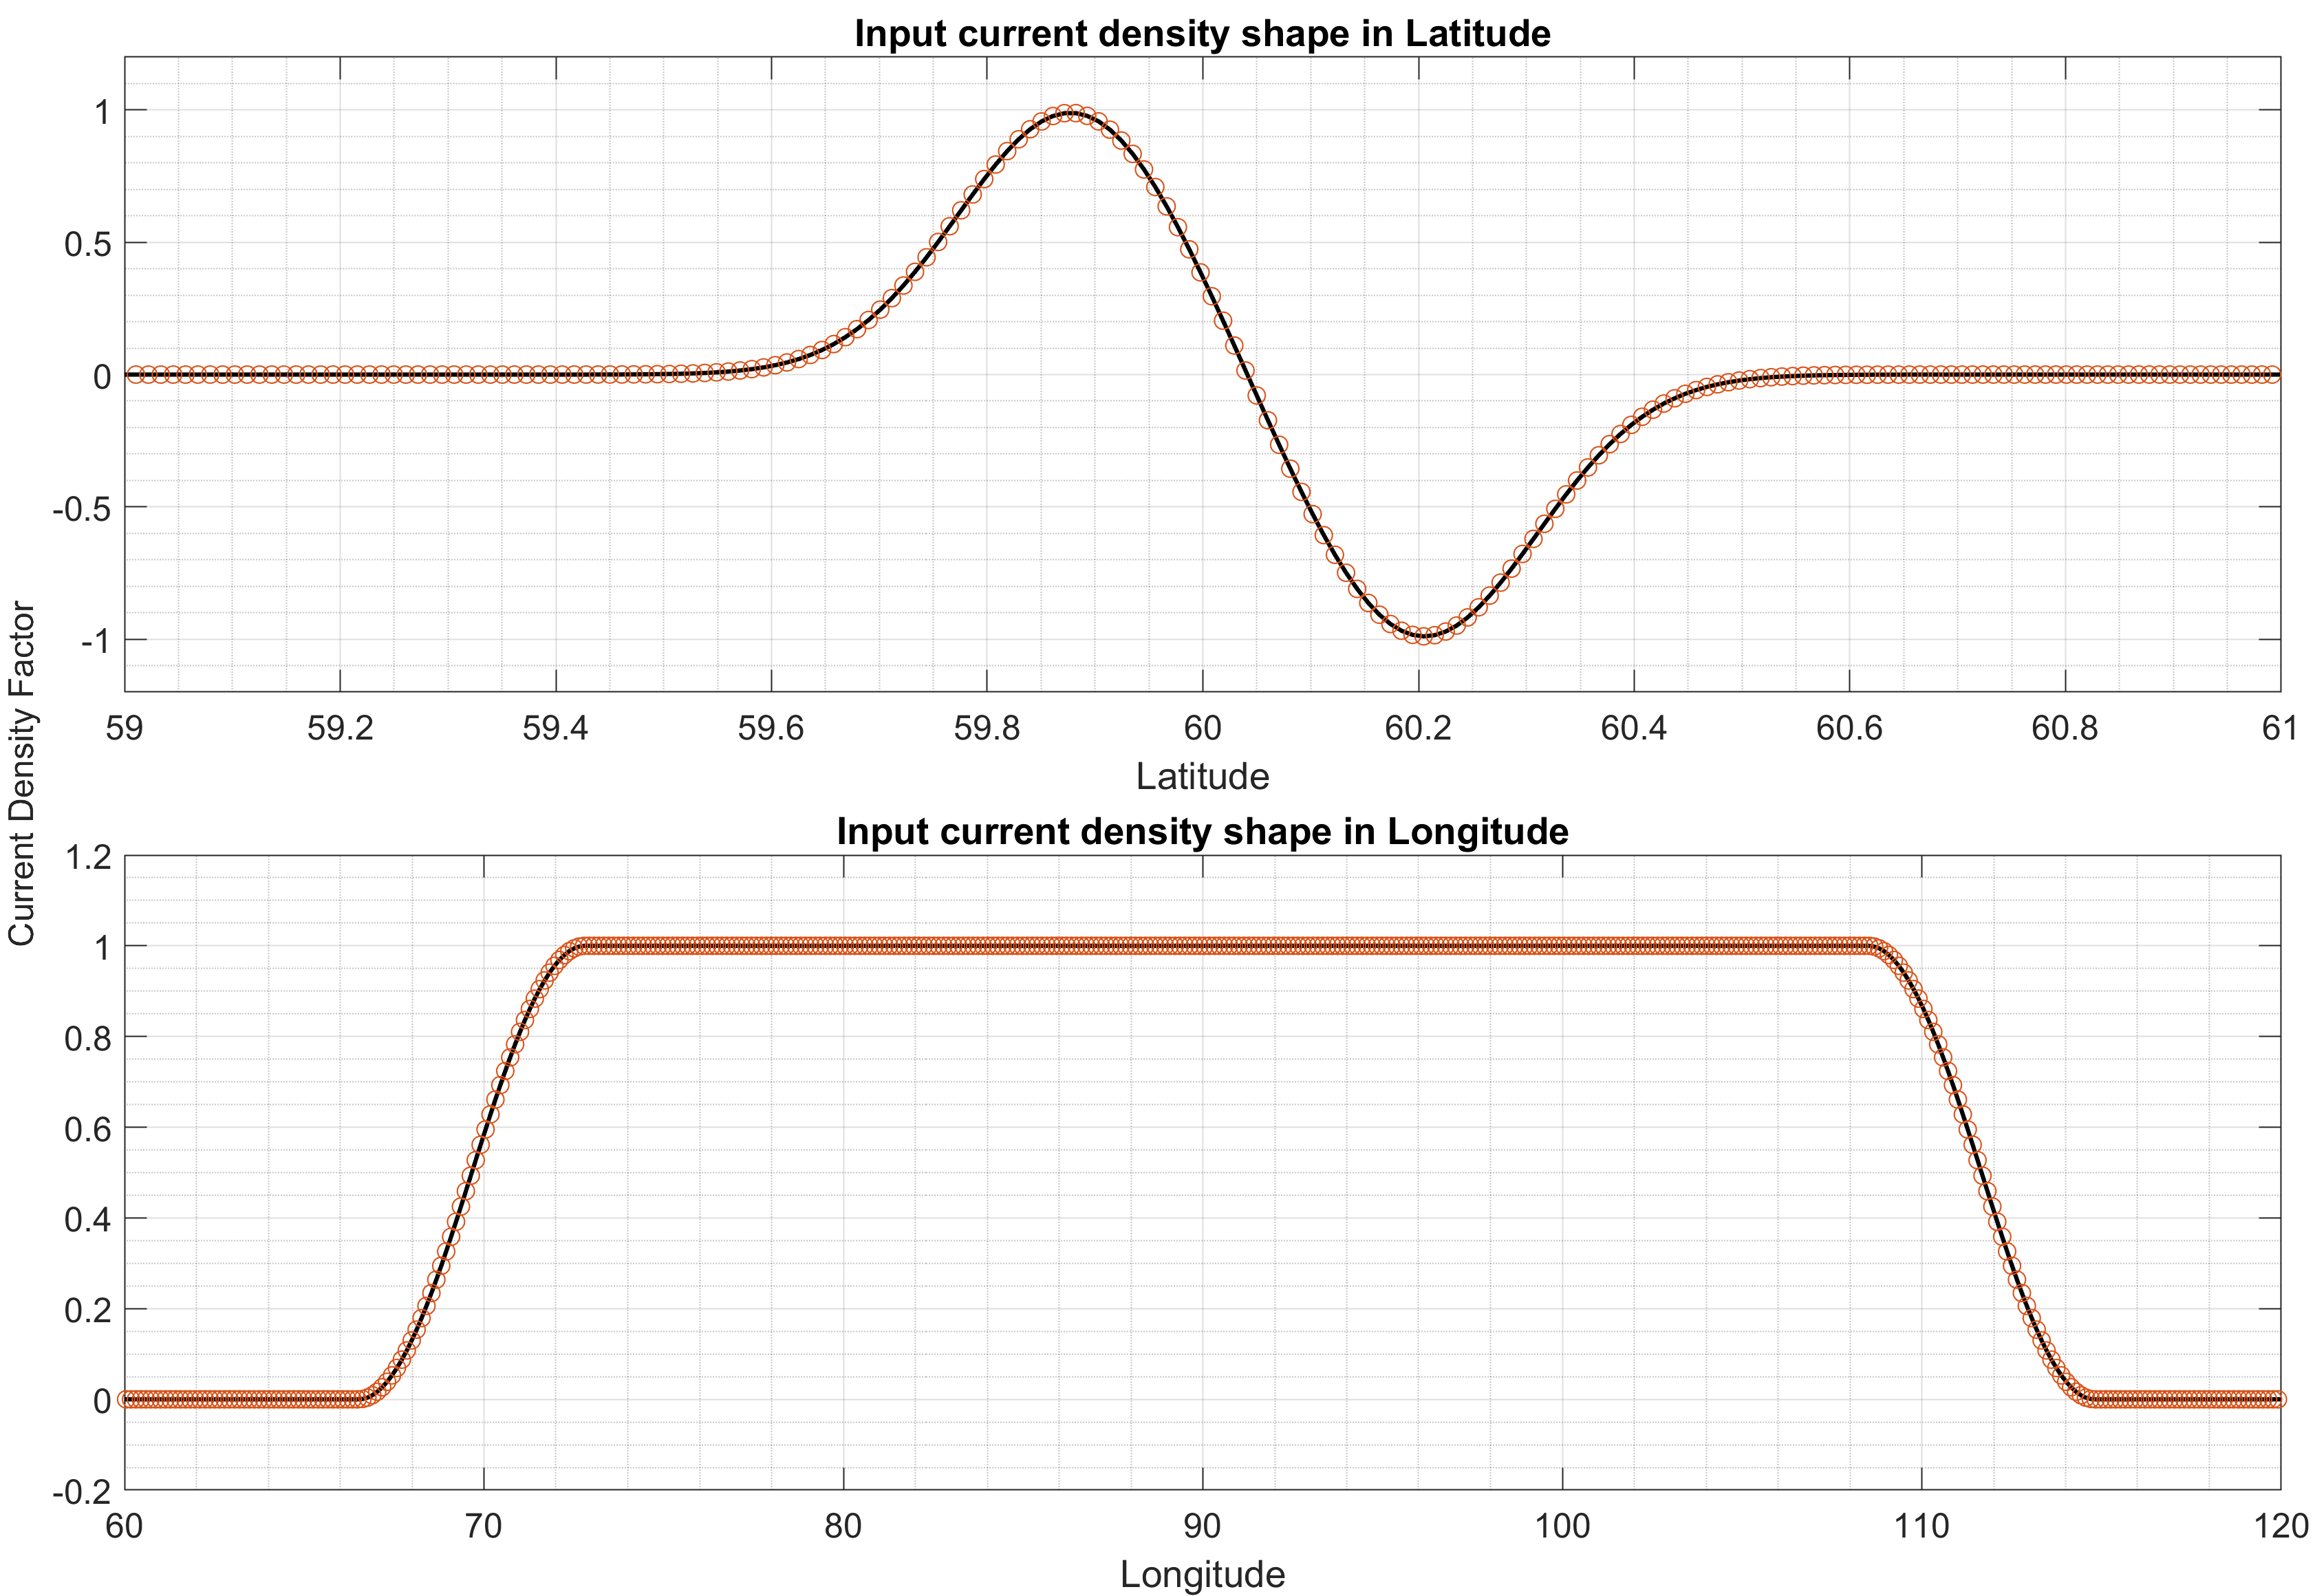
Space-based observations of the signatures associated with STEVE show how this phenomenon might be closely related to an extreme version of a SAID channel. Measurements show high velocities ($>$4km/s), high temperatures ($>$4,000 K), and very large current density drivers (up to 1$\mu$A/m$^2$). This phenomena happens in a small range of latitudes, less than a degree, but with a large longitudinal span. In this study, we utilize the GEMINI model to simulate an extreme SAID/STEVE. We assume a FAC density coming from the magnetosphere as the main driver, allowing all other parameters to adjust accordingly. We have two main objectives with this work: show how an extreme SAID can have velocity values comparable or larger than the ones measured under STEVE, and to display the limitations and missing physics that arise due to the extreme values of temperature and velocity. Changes had to be made to GEMINI due to the extreme conditions, particularly some neutral-collision frequencies. The importance of the temperature threshold at which some collision frequencies go outside their respective bounds, as well as significance of the energies that would cause inelastic collisions and impact ionization are displayed and discussed. We illustrate complex structures and behaviors, emphasizing the importance of 3D simulations in capturing these phenomena. Longitudinal structure is emphasized, as the channel develops differently depending on MLT. However, these simulations should be viewed as approximations due to the limited observations available to constrain the model inputs and the assumptions made to achieve sensible results.

Sebastijan Mrak

and 5 more

Joshua Semeter

and 6 more

STEVE (Strong Thermal Emission Velocity Enhancement) is an optical phenomenon of the sub-auroral ionosphere arising from extreme ion drift speeds. STEVE consists of two distinct components in true-color imagery: a mauve or whitish arc extended in the magnetic east-west direction, and a region of green emission adjacent to the arc, often structured into quasi-periodic columns aligned with the geomagnetic field (the “picket fence”). This work employs high-resolution imagery by citizen scientists in a critical examination of fine scale features within the green emission region. Of particular interest are narrow “streaks” of emission forming underneath field-aligned picket fence elements in the 100–110-km altitude range. The streaks propagate in curved trajectories with dominant direction toward STEVE from the poleward side. The elongation is along the direction of motion, suggesting a drifting point-like excitation source, with the apparent elongation due to a combination of motion blur and radiative lifetime effects. The cross-sectional dimension is <1 km, and the cases observed have a duration of ~10–30 s. The uniform coloration of all STEVE green features in these events suggests a common optical spectrum dominated by the oxygen 557.7-nm emission line. The source is most likely direct excitation of ambient oxygen by superthermal electrons generated by ionospheric turbulence induced by the extreme electric fields driving STEVE. Some conjectures about causal connections with overlying field-aligned structures are presented, based on coupling of thermal and gradient-drift instabilities, with analogues to similar dynamics observed from chemical release and ionospheric heating experiments.

Sebastijan Mrak

and 7 more

The impacts of solar eclipses on the ionosphere-thermosphere system particularly the composition, density, and transport are studied using numerical simulation and subsequent model-data comparison. We introduce a model of a solar eclipse mask (shadow) at Extreme Ultra Violet (EUV) wavelengths that computes the corresponding shadowing as a function of space, time, and wavelength of the input solar image. The current model includes interfaces for Solar Dynamics Observatory (SDO) and Geostationary Operational Environmental Satellites (GOES) EUV telescopes providing solar images at nine different wavelengths. We show the significance of the EUV eclipse shadow spatial variability and that it varies significantly with wavelength owing to the highly variable solar coronal emissions. We demonstrate geometrical differences between the EUV eclipse shadow compared to a geometrically symmetric simplification revealing changes in occultation vary $\pm$20\%. The EUV eclipse mask is validated with in-situ solar flux measurements by the PROBA2/LYRA instrument suite showing the model captures the morphology and amplitudes of transient variability while the modeled gradients are slower. The effects of spatially EUV eclipse masks are investigated with Global Ionosphere Thermosphere Model (GITM) for the 21 August 2017 eclipse. The results reveal that the modeled EUV eclipse mask, in comparison with the geometrically symmetric approximation, causes changes in the Total Electron Content (TEC) in order of $\pm$20\%, 5-20\% in F-region plasma drift, and 20-30\% in F-region neutral winds.

Joaquin Diaz Pena

and 10 more

This study exploits the volumetric sampling capabilities of the Resolute Bay Incoherent Scatter Radar (RISR-N) in collaboration with all-sky imagery and in-situ measurements (DMSP) to examine the interplay between cold plasma transport and auroral precipitation during a high-latitude lobe reconnection event on the dawn side. The IMF had an impulsive negative excursion in B$_z$ embedded within a prolonged period of B$_z>0$ and B$_y<0$. The combined effects of transport and magnetic stress release associated with a reconnection pulse resulted in a co-mingling of plasma patches and soft electron precipitation, creating regions of elevated electron density and temperature. Altitude profiles of ionospheric parameters extracted in the rest frame of the drifting patch showed an increase in $T_e$ above 200 km and $N_e$ below 250 km (both hallmarks of soft precipitation), while also showing small and predictable changes in $N_e$ near the F-region peak over the 34-minute duration of the event. For the first time, we identified that the simultaneous appearance of elevated $T_e$ and elevated F-region $N_e$ (i.e., a ‘hot patch’), thus providing a new formation process for hot patches. The physics-based GEMINI model was used to explore the response to the observed precipitation as a function of altitude and time. Enhancements in $N_e$ in the topside ionosphere (e.g., DMSP altitudes) are caused by upward ambipolar diffusion induced by ionospheric heating and not impact ionization. The study highlights the importance of densely distributed measurements in space and time for understanding both mesoscale and small-scale ionospheric dynamics in regions subject to complex forcing.

Sebastijan Mrak

and 5 more

Solar eclipses cause profound effects on ionosphere-thermosphere dynamics due to the abatement of solar Extreme Ultra Violet (EUV) irradiance. The reduced EUV flux cause relative reduction of ionospheric plasma density and temperature, and well as it reduces thermospheric temperature, and alters neutral winds. Numerical simulations are used to understand and characterize the ionosphere-thermosphere response to solar eclipses and to compare the model results with observations. The models have traditionally implemented simplified solar eclipses, assuming spherically symmetric models with the maximum eclipse (obscuration) set to ~15%. We present a realistic model of solar eclipses, using Solar Dynamic Observatory (SDO) Atmospheric Imaging Assembly (AIA) images of the solar corona. This model computes the eclipse occultation factors as a function of geolocation and time for a chosen SDO AIA wavelength. The model includes an interface to retrieve raw high-resolution SDO AIA, the model includes horizon computation for a smooth and accurate transition at the terminators. The model is 100% pythonic, featuring parallel execution. We present observations and numerical simulations of the ionosphere-thermosphere system bolstering the importance of the accurate EUV eclipse description. We present use 21 August 2017, and 10 June 2021 solar eclipses as examples to show the effects of realistic EUV flux and transient gradients within the penumbra, and compare it with simulations using symmetric penumbra. We integrated the EUV penumbra in the Global Ionosphere Thermosphere Model (GITM), and show that the difference between EUV and symmetric eclipse amounts to as much as plus-minus 1 TECu.

Sebastijan Mrak

and 5 more

Marc Hairston

and 3 more

In previous work (Hairston et al., GRL doi 10.1029/2018GL077381, 2018) we showed the topside F-layer (~850 km) electron temperatures measured by two DMSP spacecraft as they flew through the Moon’s shadow during the 21 August 2017 eclipse exhibited a series of non-uniform, banded decreases rather than a broad and smooth temperature decrease. We found that making a “mask” of the shadow of the Moon eclipsing the existing active regions on the sun’s surface created a pattern on the ionosphere showing where the gradient of the EUV from the active regions was greatest. The complex pattern of these areas from the mask at the F-peak altitude at 300 km corresponded to the areas in the topside F-layer where the DMSP observed the bands of cooled electrons. We have expanded this work to examine about a dozen other eclipses including the most recent 21 June 2020 eclipse. We repeatedly observed the same banded pattern in the electron temperatures in almost all the DMSP eclipse passes, thus demonstrating this is a repeatable phenomenon. Since the DMSP series of spacecraft form a constellation of four operational satellites with the same plasma instrument package making multiple measurements of the shadow at different local times, and sometimes within 10-15 minutes of each other, we can use these observations to map the shape and evolution of these cooling band patterns as the eclipse’s shadow passes over the Earth’s ionosphere. Here we will present our first detailed analysis of the two eclipses that occurred on 20-21 May 2012 and 2 July 2019. Both these eclipses have passes through the duskside by two spacecraft within a few minutes of each other, thus allowing us to examine the evolution of the pattern. We are using these events to determine the empirical patterns seen in the electron temperature decreases during eclipses and to explore the mechanism causing the cooling of the plasma and how it is transported from the F-peak region to the topside ionosphere.